

X-Ray: PHP performance tracking
Actualizado hace 2 semanas
Los sitios dinámicos hechos con gestores de contenido sufren de cuellos de botella por algún lado. Wordpress, Drupal, Joomla y Magento son ejemplos clásicos de sitios maravillosos, y muchas veces lentos. Pero ya no tendremos que investigar a fondo para solventar las causas dado que una nueva herramienta —parte de CloudLinux OS Shared Pro— vino a resolverlo por nosotros: PHP X-Ray.
¿Un problema con un plugin, una ralentización en las consultas a la base de datos, un conflicto en una función o llamada externa? X-Ray nos va a revelar su origen.
¿Qué es PHP X-Ray?
PHP X-Ray es un sistema informático de seguimiento interno de lo que sucede en un sitio de internet (siempre y cuando su servidor cuente con CloudLinux OS Shared Pro). PHP X-Ray nos permite analizar el uso de recursos de nuestra página web y encontrar la causa de un alto uso de recursos.
PHP X-Ray fue desarrollado específicamente para solucionar problemas de rendimiento en sitios web basados en PHP. Cuellos de botella típicos son:
Plugins lentos
Consultas lentas a bases de datos
Funciones lentas
Llamadas externas lentas
Tras comenzar a correr un seguimiento, visitaremos nuestro sitio normalmente dándole a PHP X-Ray escenarios suficientes como para que encuentre los problemas. Una vez analizado el sitio, podremos ver un informe.
¿Cómo se usa PHP X-Ray?
Lo primero que debemos hacer es entrar a nuestro panel de control del sitio en cuestión.

Típicamente, escribiremos cpanel.misitio.com reemplazando misitio.com por la URL real de nuestra web.
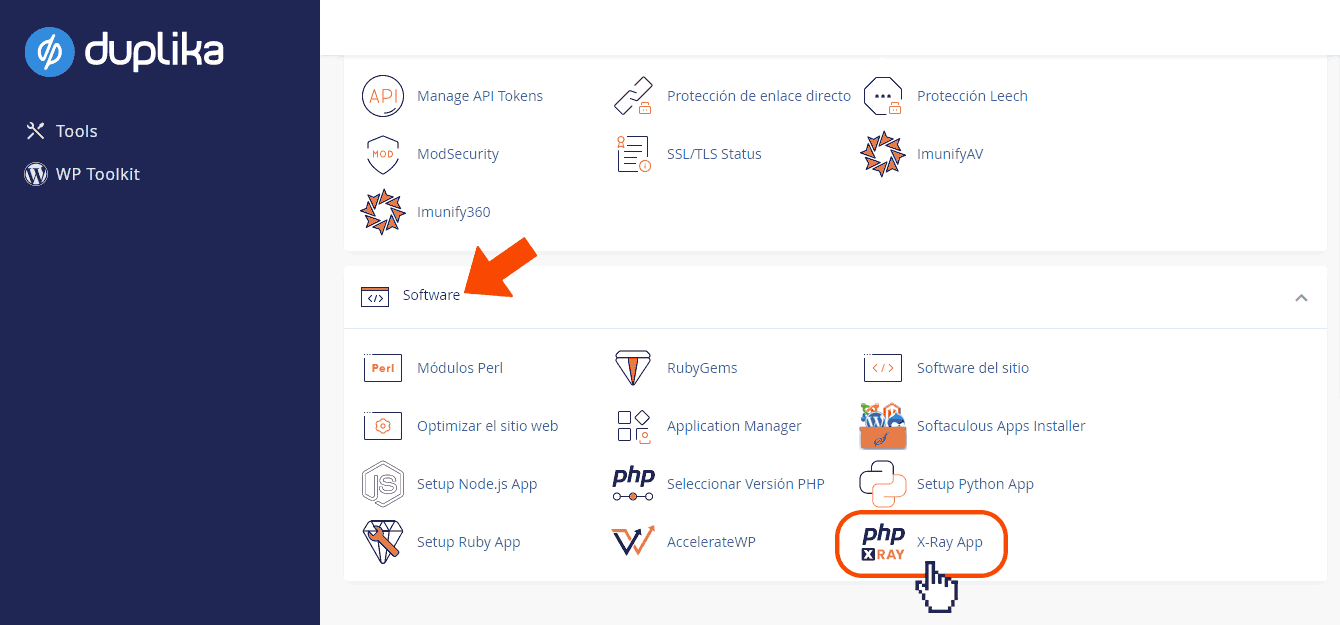
Tras ingresar al cPanel, buscaremos el ícono señalado en la captura inferior dentro del grupo de apps "Software".
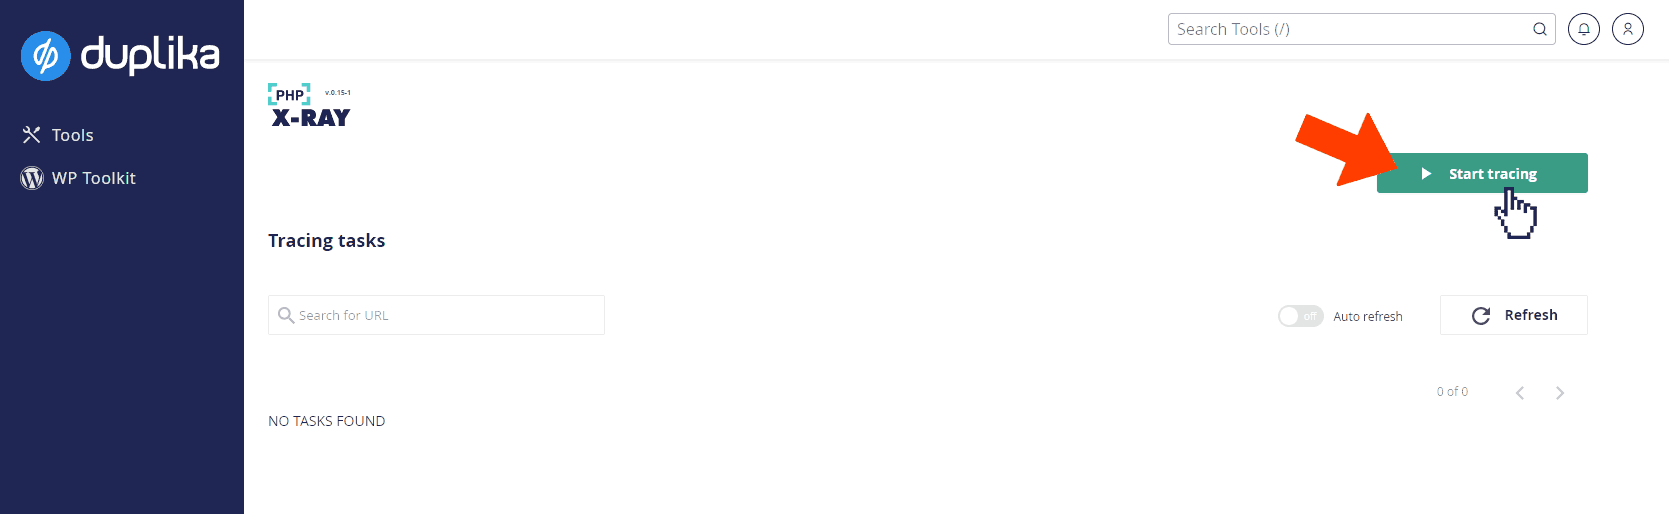
Se nos presentará la siguiente pantalla en donde sólo debemos hacer clic en el botón verde.
A continuación, eligiremos el dominio en el menú desplegable.
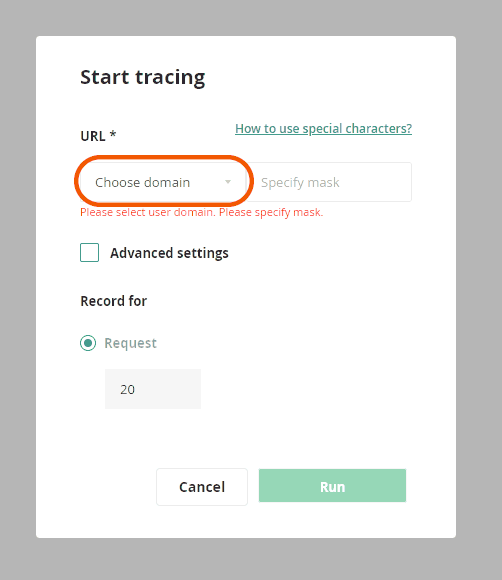
Y luego escribiremos una "máscara", es decir una url específica. Si queremos sondear el sitio entero, basta escribir un asterisco como se visualiza en la captura inferior.
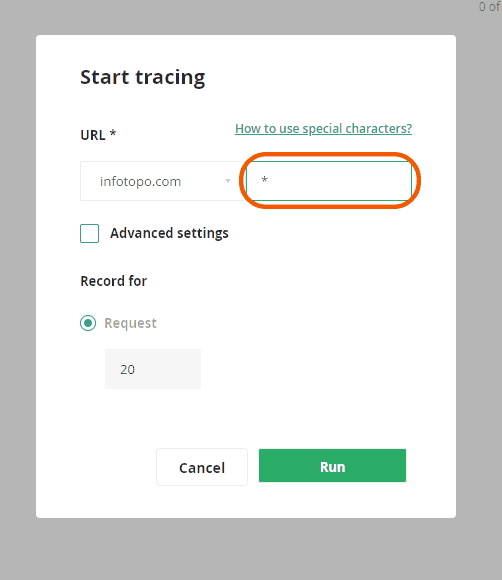
Finalmente, clic sobre el botón de RUN.
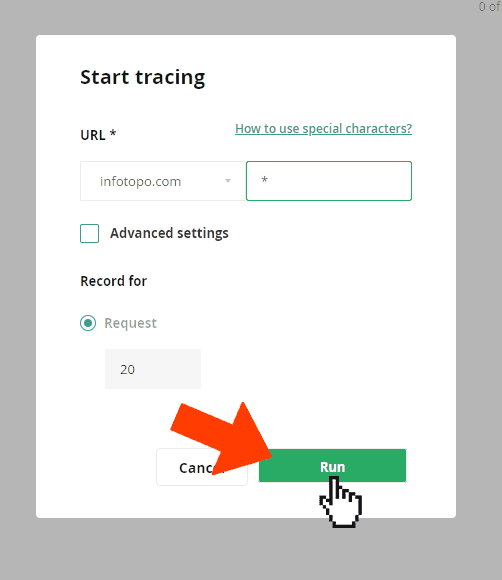
Tras una pequeña animación de carga, la página se refrescará y veremos algo parecido a lo siguiente:
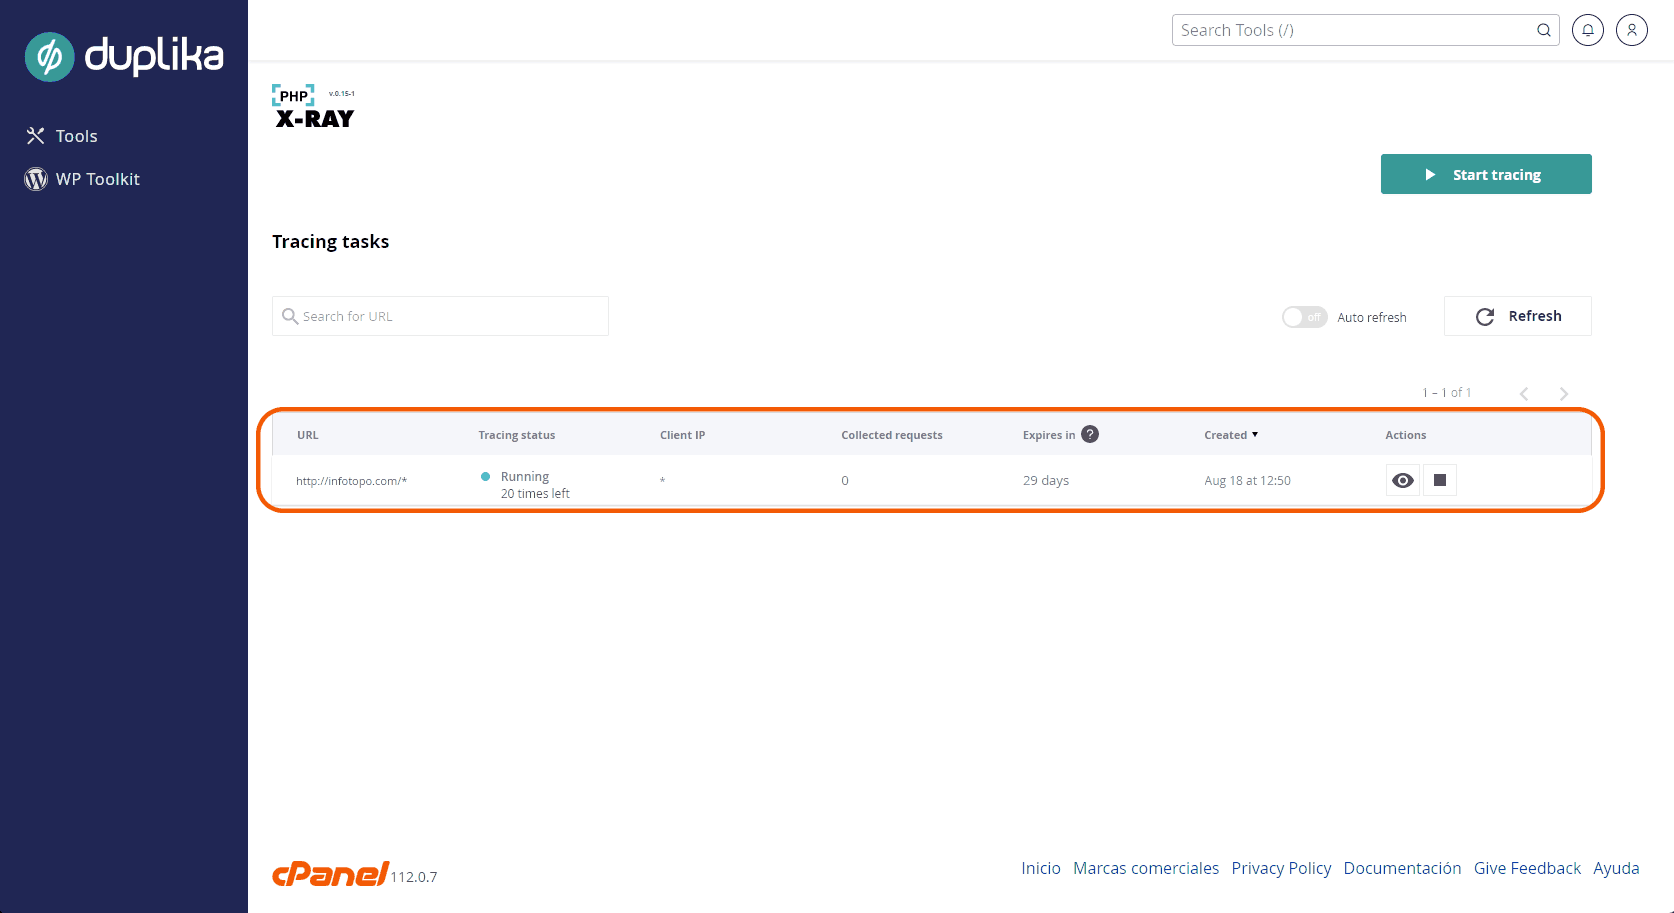
Las siete columnas nos muestran la siguiente información (1) La url del domino (y carpeta) en donde se está ejecutando el escaneo. Como hemos escrito asterisco en la sección de máscara, esto dará por resultado un estudio de todo el sitio completo (a diferencia de si ingresamos una carpeta, por ejemplo "blog"; en ese caso sólo se comprobarán cuellos de botella en dicha sección). (2) El estado de seguimiento. (3) El IP del cliente. (4) La cantidad de muestras recolectadas en el tiempo transcurrido (al comenzar el scan, será cero por lógica). (5) El tiempo que tarda el estudio en completarse (son 30 días) (6) La fecha de creación de la comprobación de cuellos de botella. (7) Se muestran dos botones. El ícono del ojo sirve para ir comprobando reportes de problemas en una pantalla separada, y el cuadrado de stop nos deja detener la comprobación creada (previo mensaje de confirmación, por si lo tocamos por error).
En la medida en que se recavan problemas, los mismos irán apareciendo ordenados por el conflicto que más ralentiza nuestro sitio arriba de todo.
Por ejemplo, si resulta que un plugin instalado es el causante de las lentitudes gruesas de nuestra web, podemos desinstalarlo y probar uno que cumpla las mismas necesidades pero sin poner en jaque nuestros recursos.
Ver los informes del estudio terminado
En cualquier momento podemos ver qué está pasando tal cual mencionamos, presionando el ícono del ojo. Este mismo botón es al que acudiremos también terminado el seguimiento.

Así, podremos ver algo compatible con la captura inferior.
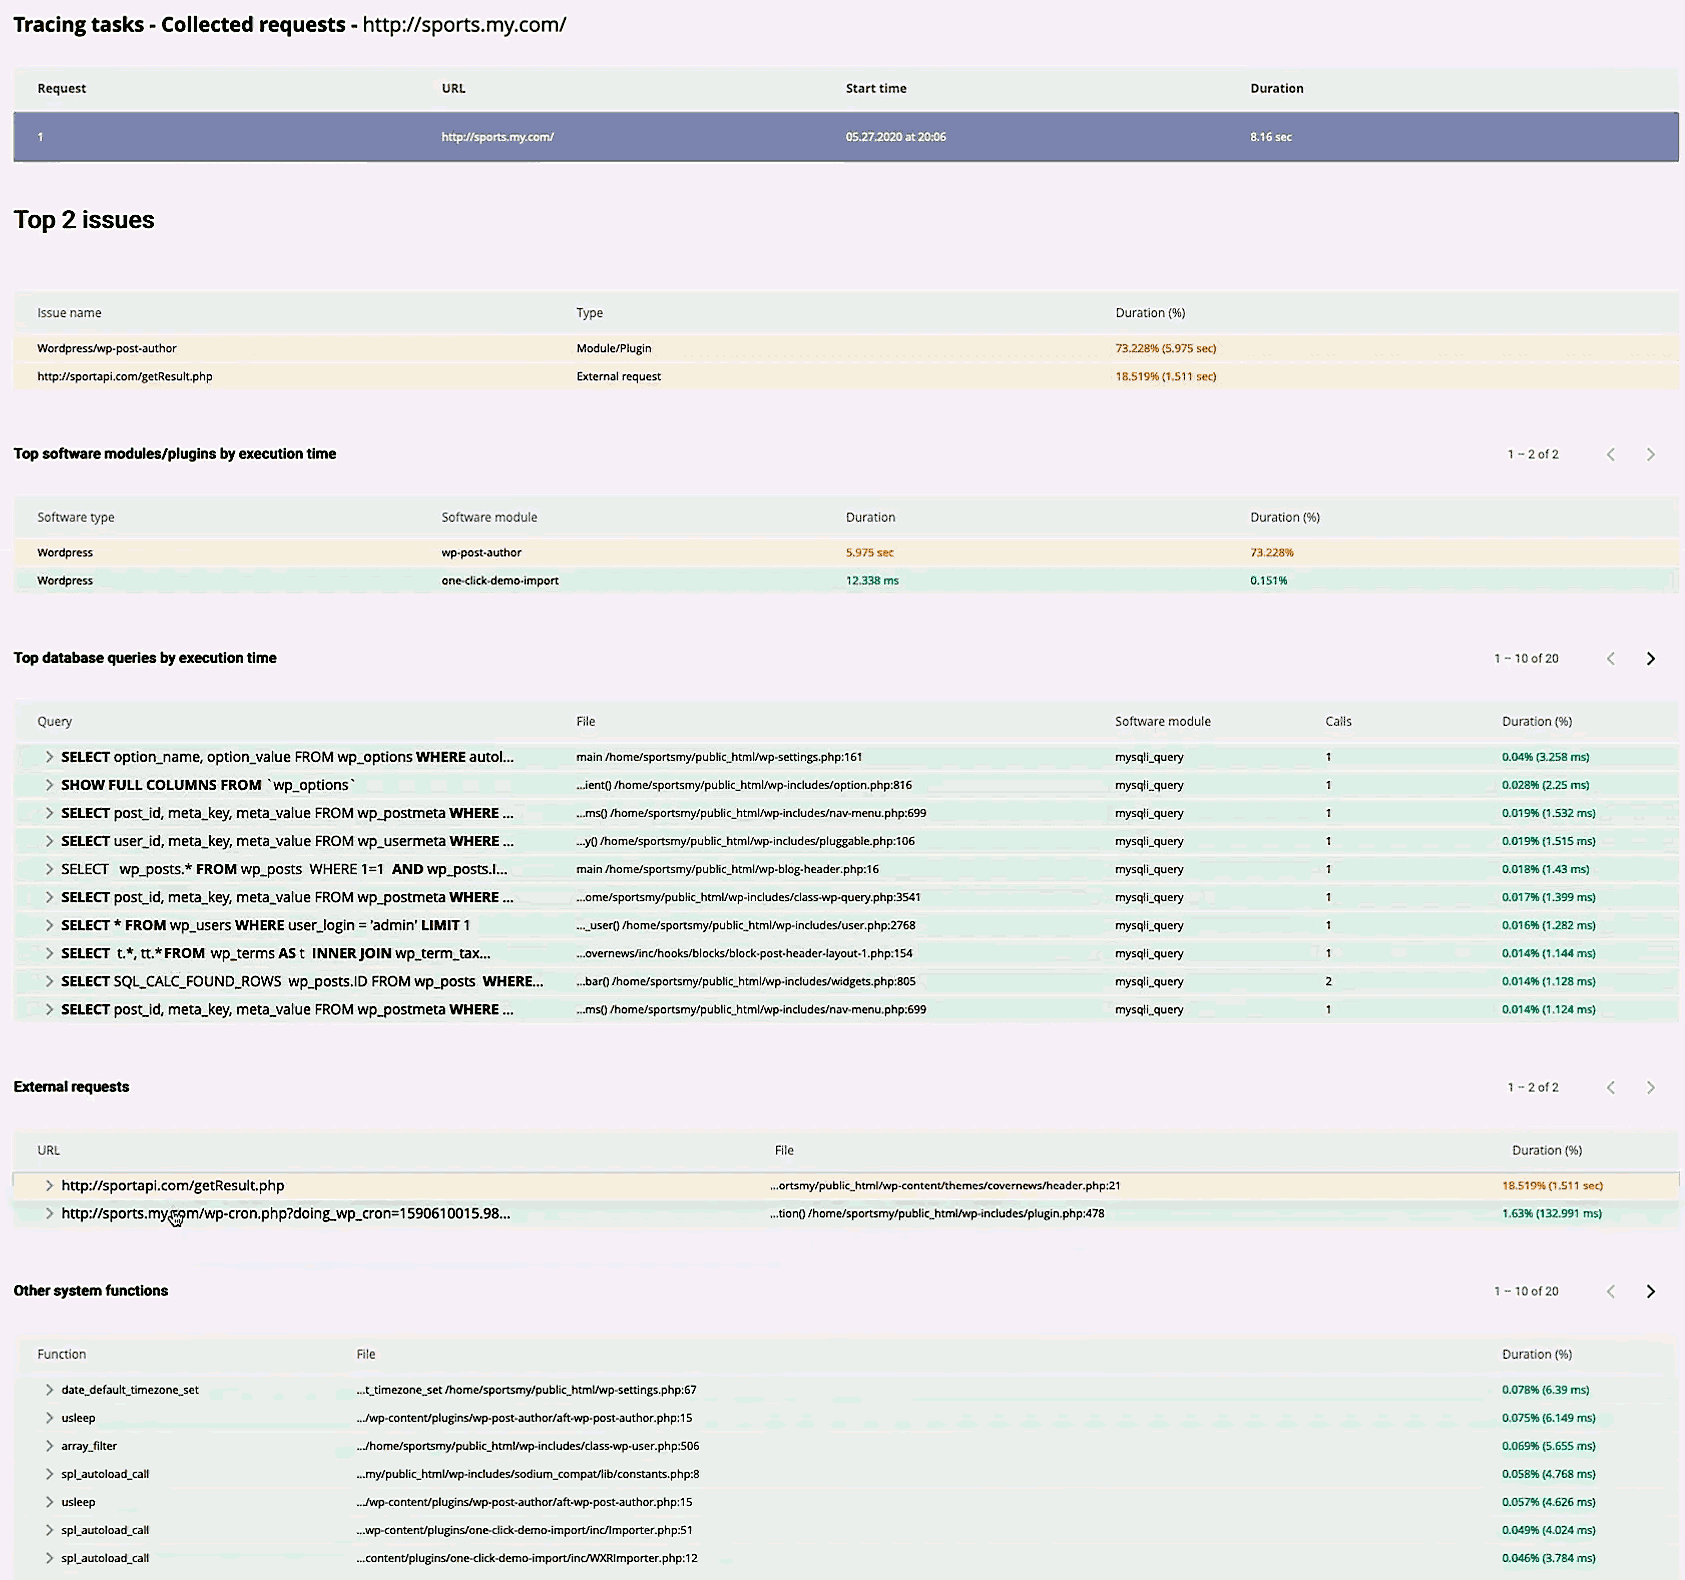
Por supuesto, dependiendo del problema y también de cuánto estamos familiarizados con nuestro CMS, PHP o funcionamiento de un servidor, es que iremos solventando los ítems presentados en el informe. Generalmente, los problemas notables se presentan en componentes, por lo que deberemos realizar pruebas en este sentido (o directamente desinstalar algo que funciona mal, tirando abajo todo el sitio).
Paralelamente, podemos ver un video acerca del procedimiento: