

How to Measure Our Website's Performance Locally with Google Lighthouse?
Updated last month
Google Lighthouse is a free tool that we can—and should—use to audit our website and check its performance (that is, its speed). It also lets us lift the hood to inspect its accessibility, SEO performance, and whether it follows so-called “best” practices (website security, proper resource usage, and so on).
In this guide, we’ll see how to use Google Lighthouse to our advantage by explaining what it does and how to understand the scores provided in its report. Let’s begin.
What is Google Lighthouse?
In a way, it’s like putting on Google’s glasses—without Google charging us a cent. When we generate a Lighthouse report, we can evaluate our website’s page experience and access nothing less than very valuable advice if we want to improve its performance. In recent years, Google has placed increasing emphasis on the experience of each web page, including the addition of a new set of signals to Core Web Vitals called INP. Lighthouse data dissects how a user experiences browsing our site, giving us a clear snapshot of its speed, bottlenecks, and everything that can be improved.
How do I use Google Lighthouse?
→ NOTE: later on, we’ll explain how to install it in Firefox and how to use it with Google Insights.
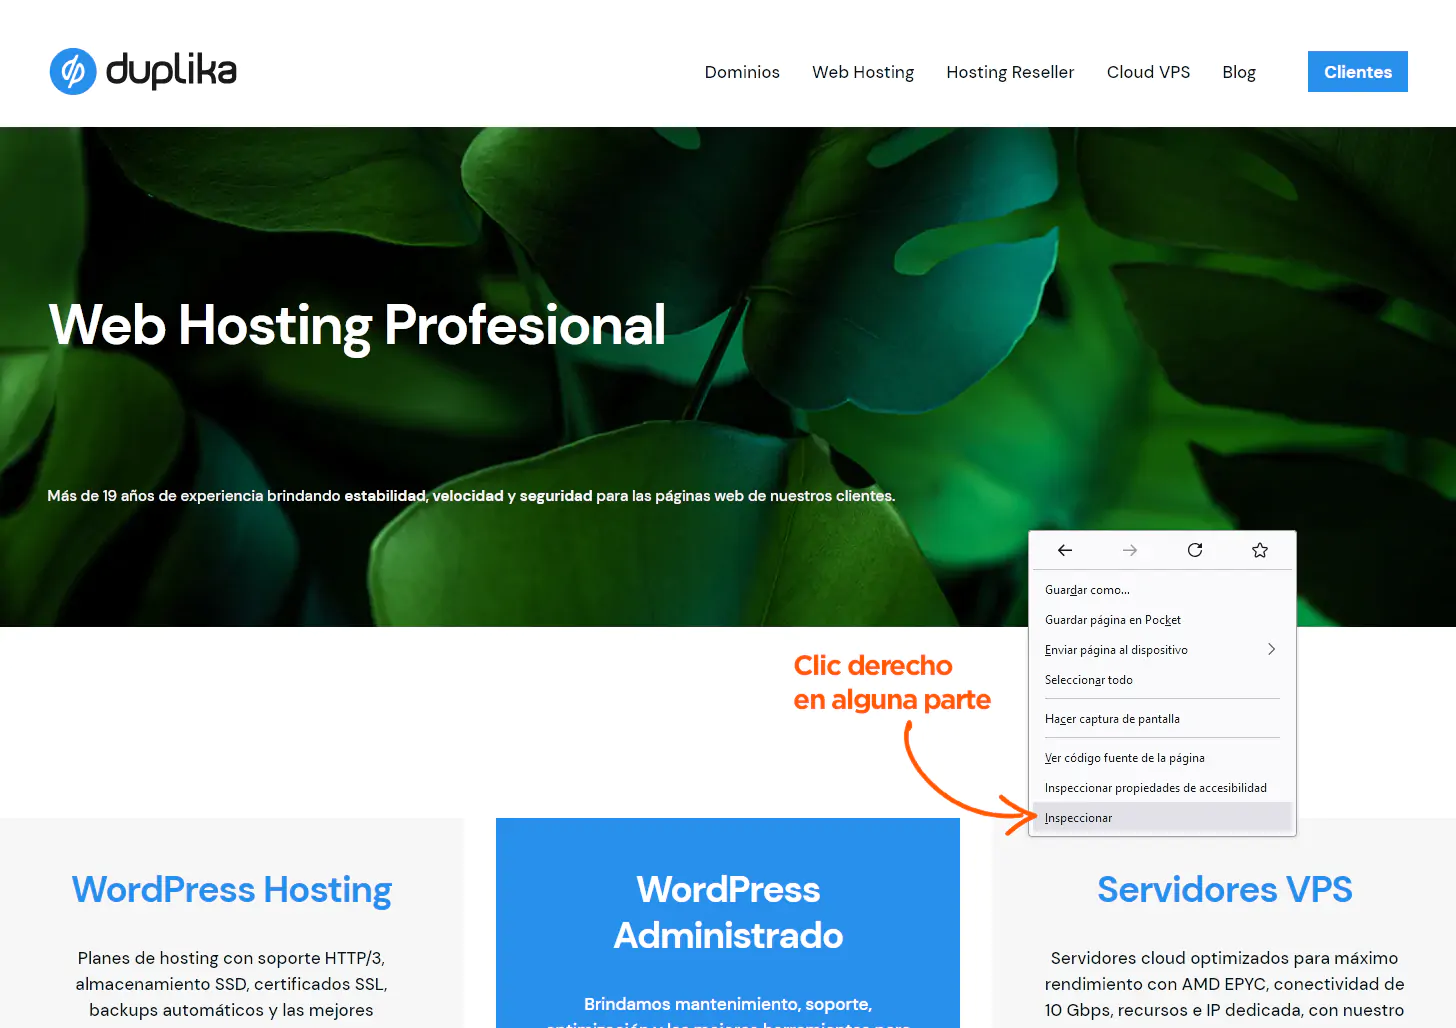
Google Lighthouse is integrated into the Chrome browser. The most direct way to use it is through the *DevTools* (developer tools) built into that browser. To use it, we’ll click anywhere on a site and select INSPECT from the pop-up menu.
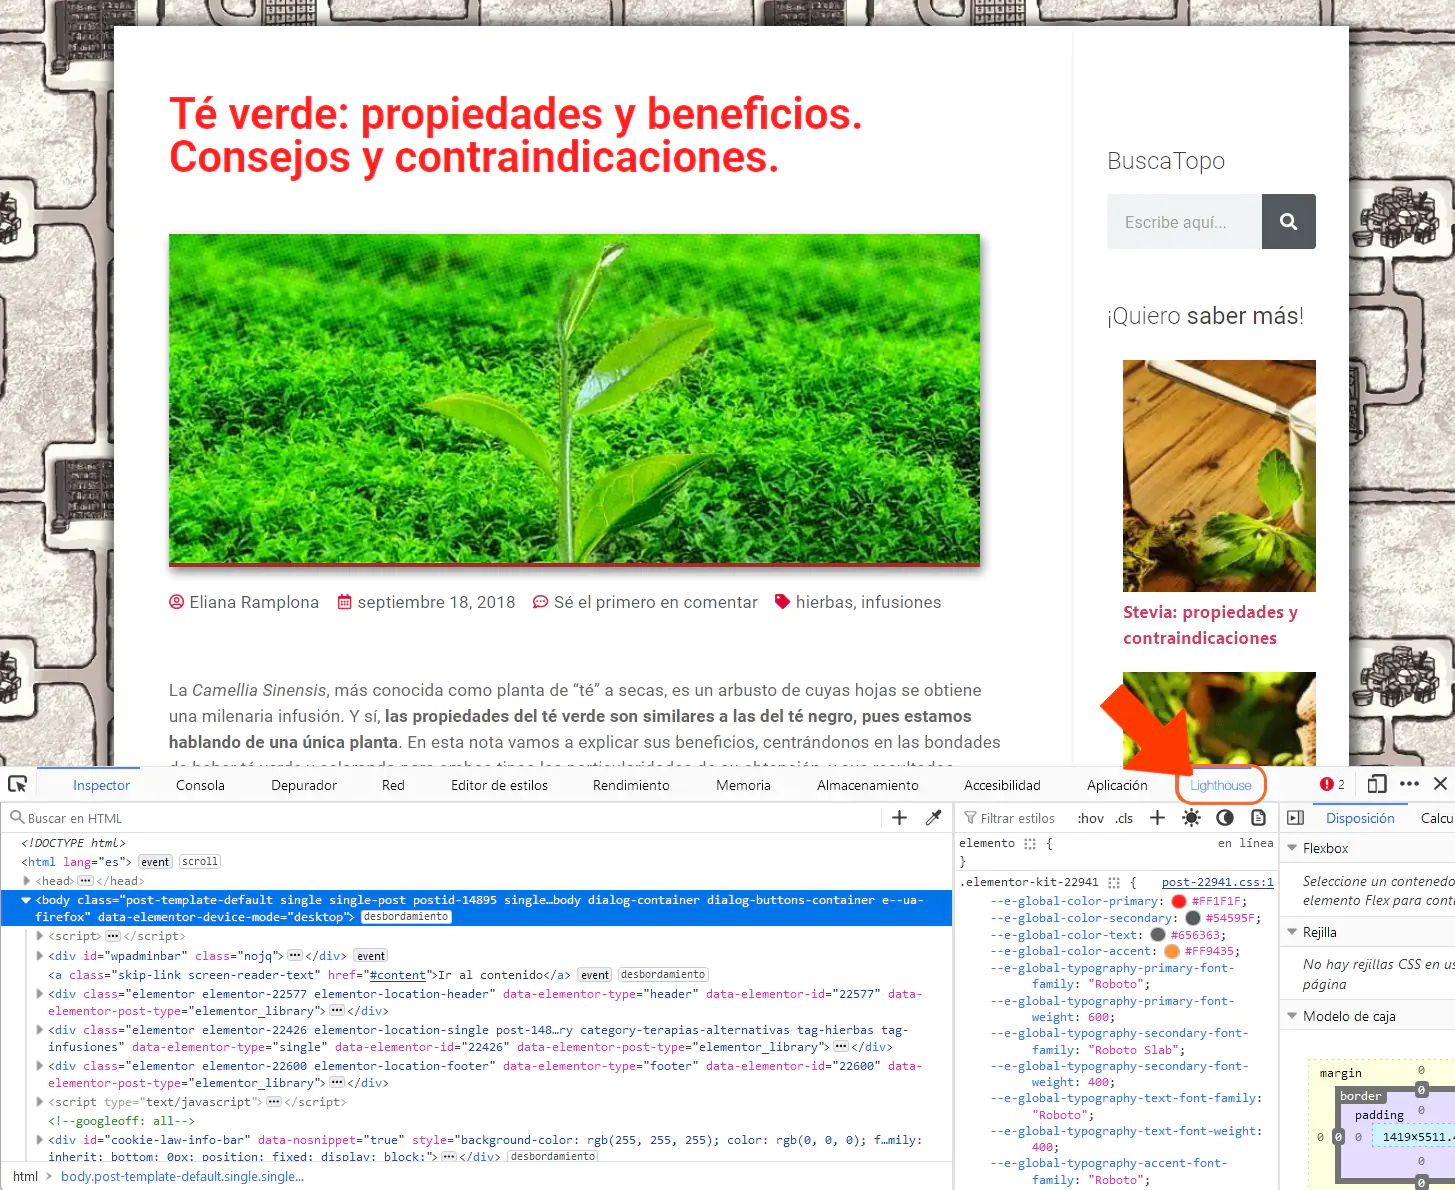
The screen will split in two to show us the *DevTools* mentioned above. We’ll look for the LIGHTHOUSE option at the end of the list of tools (if we don’t see it, we can click the double-arrow icon at the end of the list to display the tools hidden due to limited space).
Once selected, a message will immediately appear indicating that Lighthouse results are pending, and then a view similar to the following screenshot will be displayed:
Understanding the Google Lighthouse Report
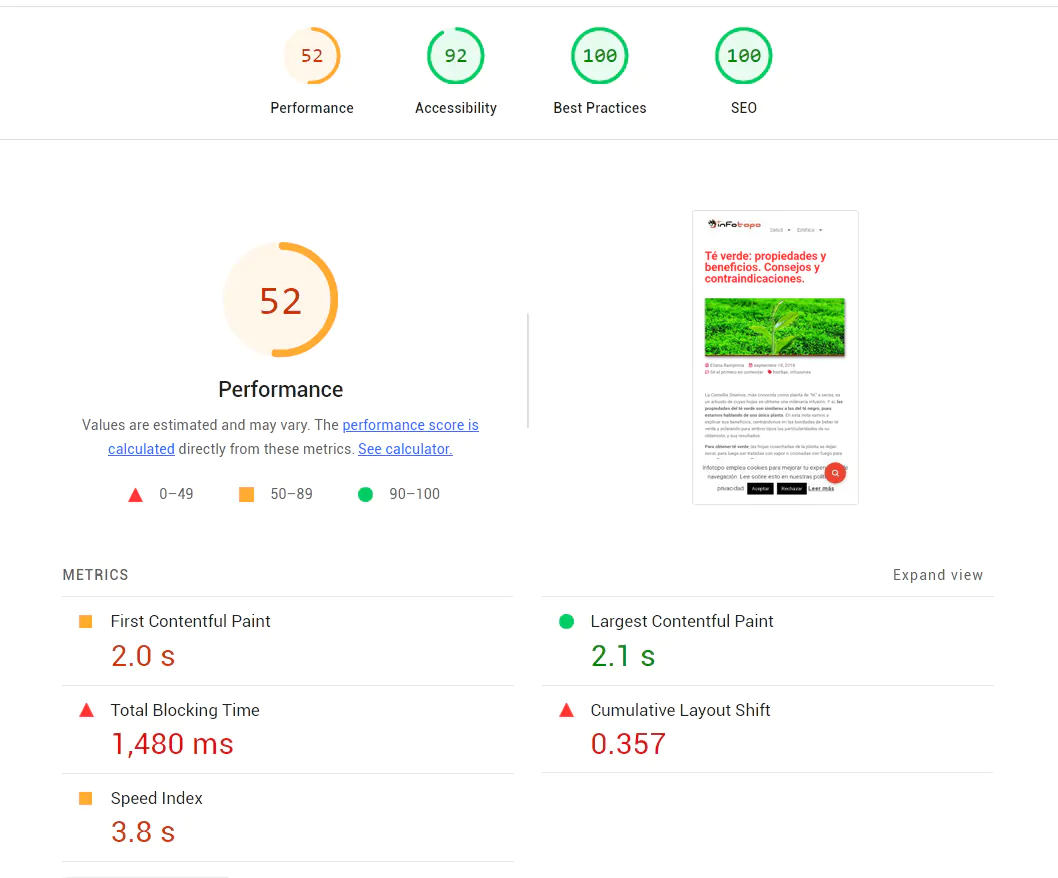
As we can see at the very beginning of the report, we’re shown four score circles: Performance, Accessibility, Best Practices, and SEO.
Let’s start at the beginning: performance.
Performance
Performance is, quite simply, our site’s loading speed. In other words, it is the time it takes for our content to load so visitors can see and interact with it.
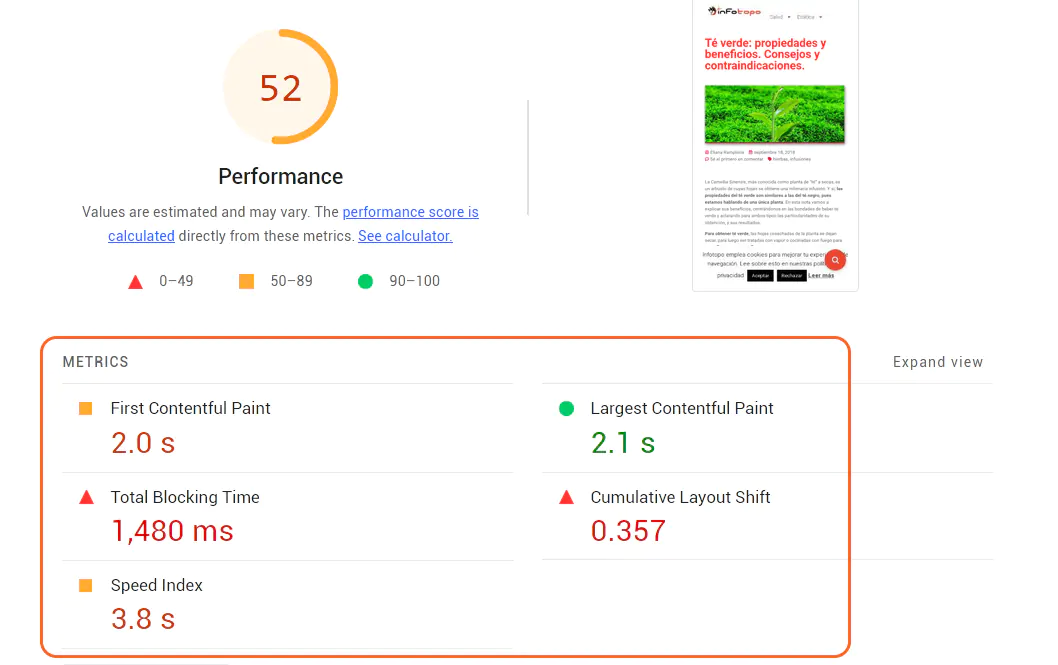
These metrics are demanding (just as Google is, in fact). We shouldn’t be surprised if orange or red circles appear. In fact, the surprise would be for everything to be green (unless the site has been worked on to improve its SEO or we have a highly efficient Theme and Components with a hosting server to match).
Now, let’s see what the data shown in the highlighted rectangle in the screenshot above means:
*First Contentful Paint* (FCP or First Contentful Paint): Measures the moment when the first text or image becomes visible to users. *Largest Contentful Paint* (LCP or Largest Contentful Paint): Calculates how long it takes a page to load its largest element (such as a photograph or carousel). *Total Blocking Time* (TBT or Total Blocking Time): Measures the amount of time during which a page does not allow any interaction from the visitor (for example, a mouse click). *Cumulative Layout Shift* (CLS or Cumulative Layout Shift): Measures the layout changes that occur as content loads (this results in blocks being rearranged, something typical during page loading but which prevents users from beginning to read or interact correctly; therefore, this interval should be minimal). *Speed Index* (SI or Speed Index): Expresses how quickly the content on our page loads.
The final score is the sum of all the metrics, and ranges from 0 to 100. If it is 90 or higher, the circle will be green, indicating a very good loading experience. Below 90, Google Lighthouse warns us that there are many things that can be improved—in other words, bottlenecks and slowdowns.
The good news is that it doesn’t just give us a score: it provides all the specific suggestions we need to improve our site’s loading speed.
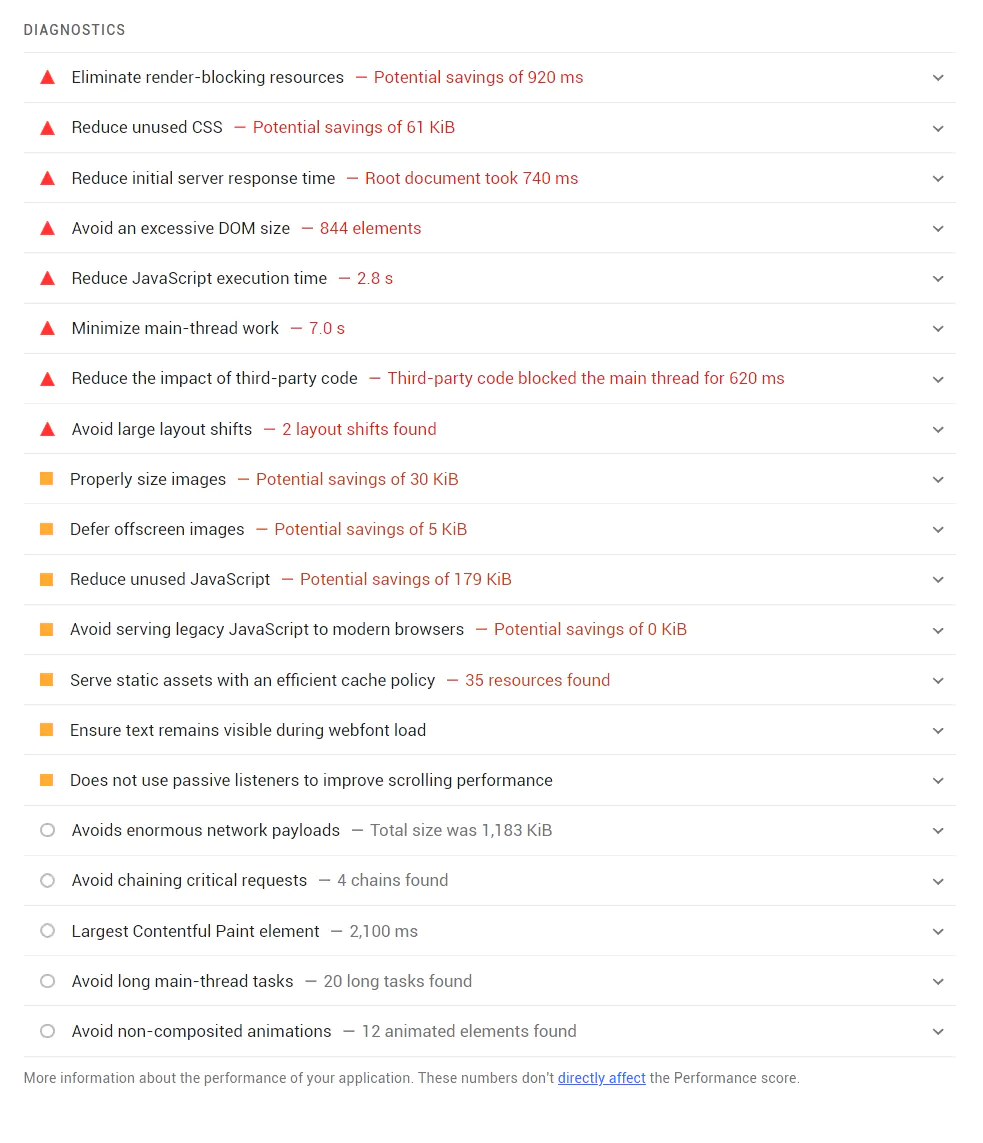
It is true that many factors will depend on our site’s programming. If we have a website built with WordPress, the Theme used and the installed plugins carry a lot of weight. In addition, the caching plugin we use is essential. If improving our score exceeds our level of knowledge, but we are committed to increasing our traffic and optimizing content navigation for everyone, we should look for a company trained to solve it (yes, like Duplika).
Accessibility
Accessibility refers to how easily people with disabilities can access and use our content. It evaluates critical aspects such as the clarity of buttons and links (for example, contrast), ensuring that they are clearly recognizable and functional, without distracting elements.
It also analyzes images to check whether a description is specified in the “alt text” (the ALT attribute in the image’s HTML). This way, when users with limited vision or blindness use screen readers, they can understand what the image is about.
We also find a score ranging from 0 to 100, with 90 to 100 being optimal.
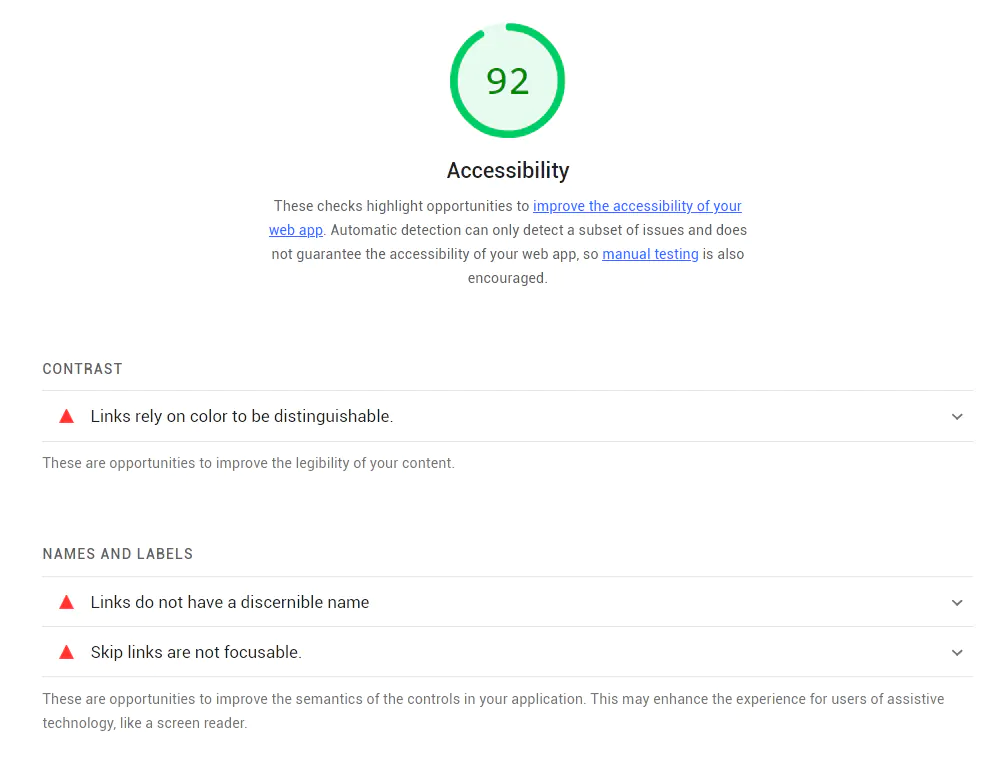
Once again, Lighthouse will tell us everything that can be improved.
Best Practices
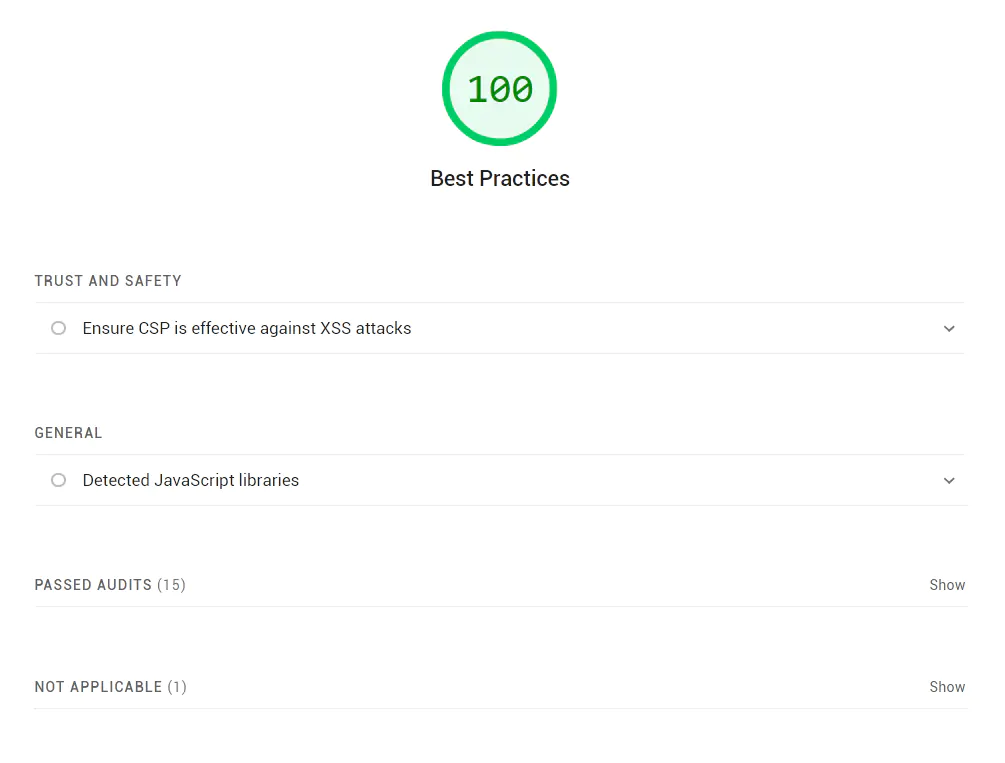
The “good practices” audit compares the programming of our content with a modern web development ideal.
As we said, ideally, the following principles should apply:
Resources are loaded from secure servers with SSL certificates, that is, over the HTTPS protocol.
All images are displayed with the correct aspect ratio and at the appropriate resolution (in other words, the images are not stretched vertically or horizontally and, on the other hand, are not larger in pixels than they appear).
All JavaScript libraries are secure, up to date, and free of known vulnerabilities.
The page has an HTML doctype.
The Content Security Policy (CSP) is effective against cross-site scripting attacks (known as XSS).
The page contains no navigation errors.
The page contains no outdated frameworks or APIs.
The page has valid map sources (the correct implementation and use of icon fonts and other vector graphics).
The page has no visible issues in Chrome DevTools (such as failed network requests, insufficient security measures, and other browser problems).
The page’s character encoding is set with the meta charset tag.
The page allows users to paste a password into password fields.
The page provides a good user experience by blocking geolocation and notification permission requests when the page loads.
SEO
The SEO evaluation in Lighthouse refers to the audit focused on the practices we use to improve our website’s visibility and ranking in search results. This measurement breaks down aspects such as:
Whether our website displays properly on mobile phones and tablets, which is essential by now.
The page has valid structured data.
Internal links are crawlable.
The page has a valid hreflang attribute.
The title and meta-description tags are completed.
The page is indexable (it is not blocked by WordPress or Robots.txt).
The Robots.txt file is valid.
The page returns an HTTP 200 status response code (meaning it is OK).
The page has a valid rel=canonical tag.
The page’s content is independent of plugins.
Links on a page contain descriptive text.
Images on a page have specified alt text.
The page has a meta-viewport tag with a defined width or initial scale.
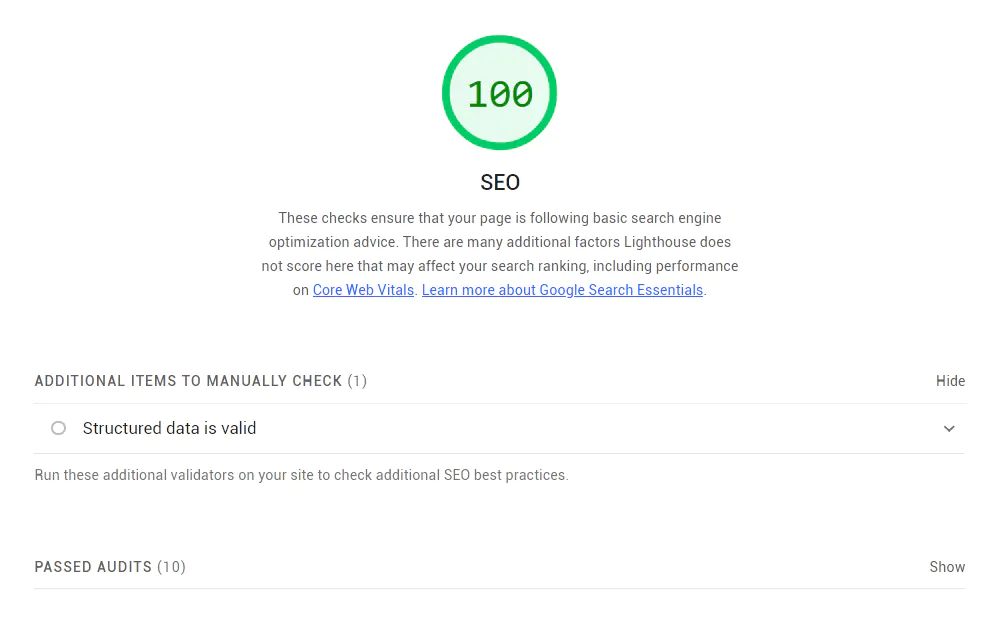
Once again, we find a score ranging from 0 to 100, plus everything we should improve if we really want to achieve better scores (that is, more traffic to our website).
How can I use Google Lighthouse with Firefox?
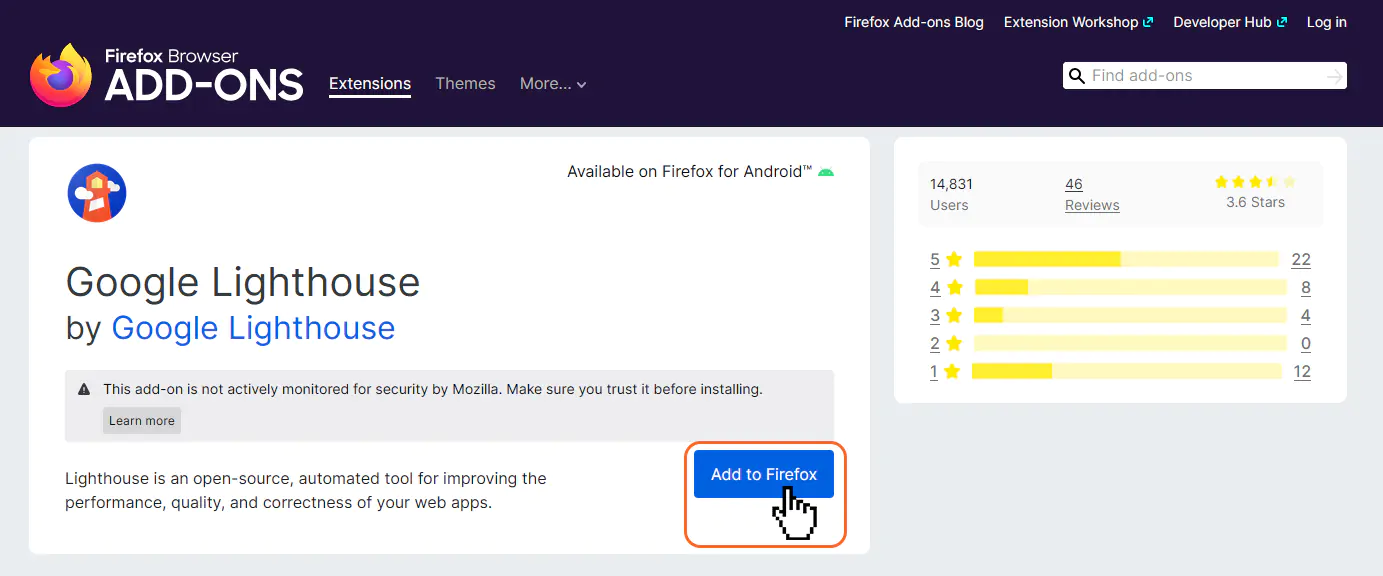
If we use the Mozilla Firefox browser, we can download Google’s official component in seconds from the Add-ons and Themes section:
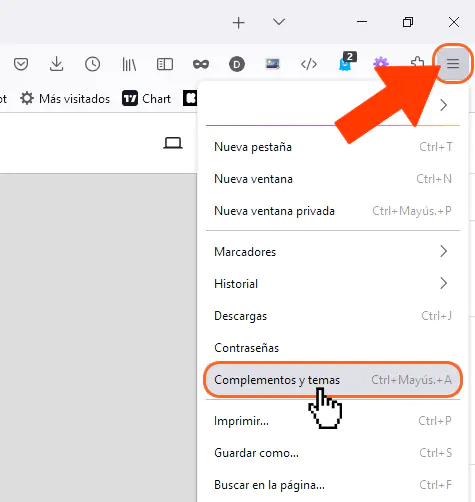
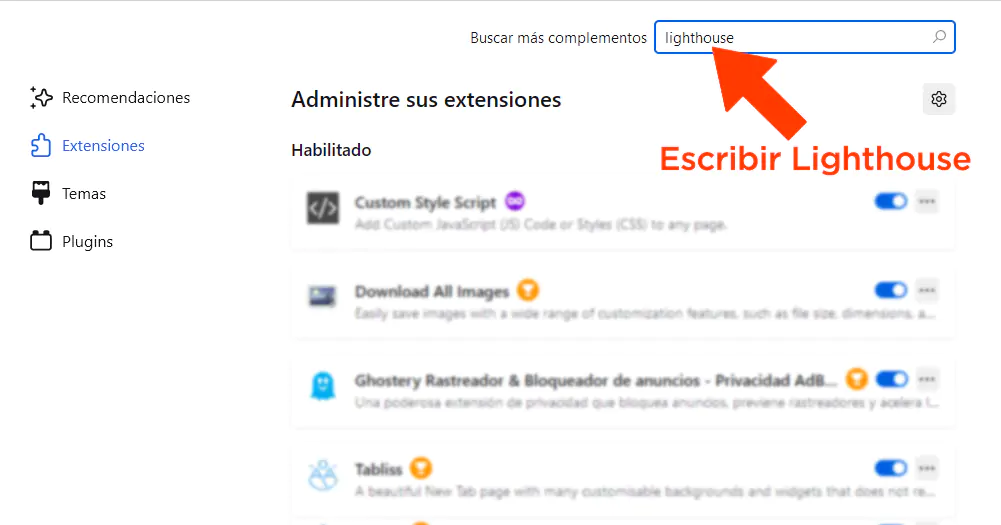
After going to the add-ons section, we need to search for it in the search field for new components.
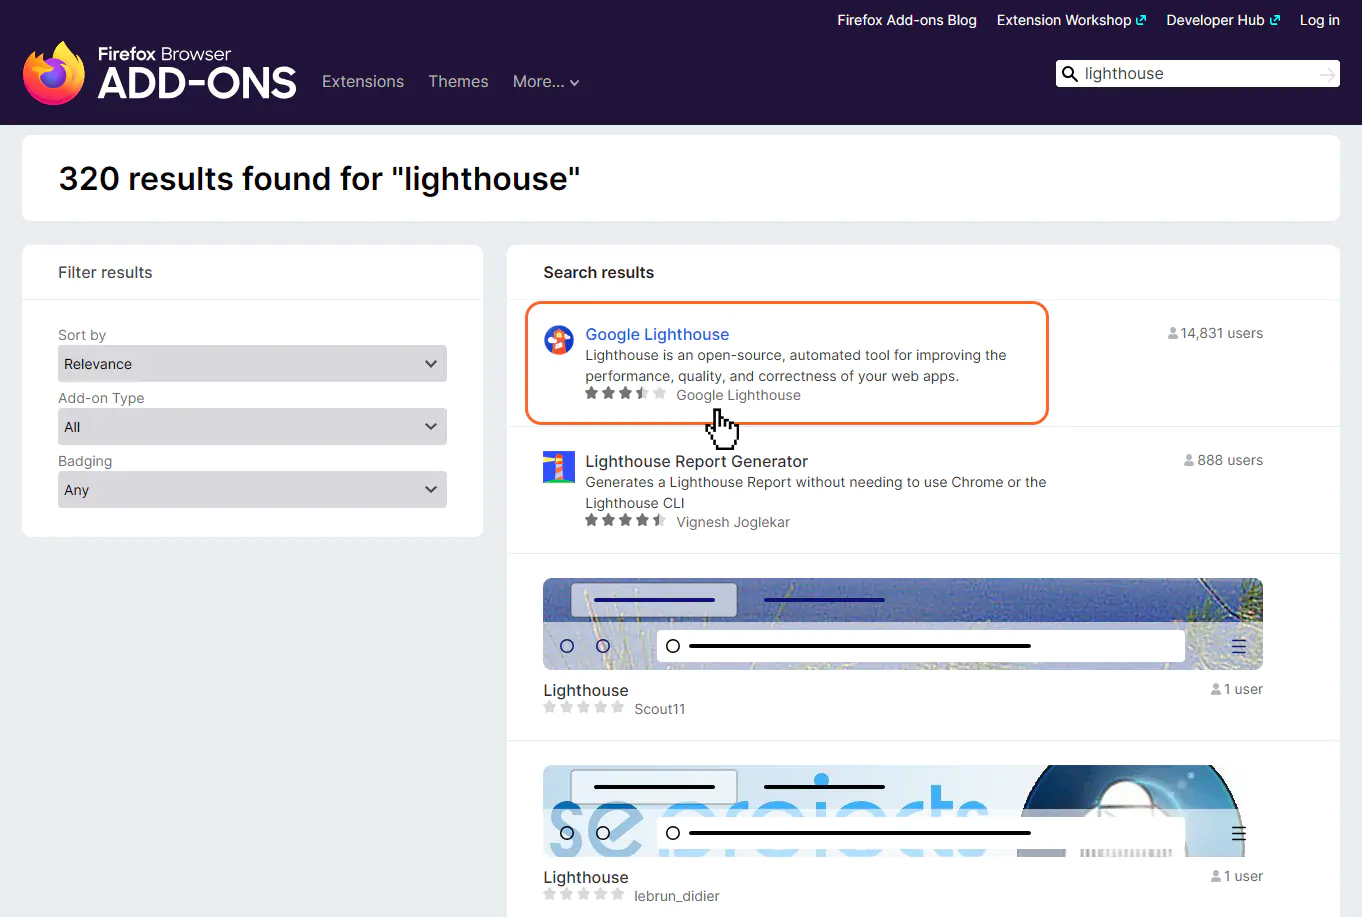
The one highlighted in the screenshot below is the official add-on developed by Google. We’ll click it to view its details and install it.
One more click on the blue button to install it.
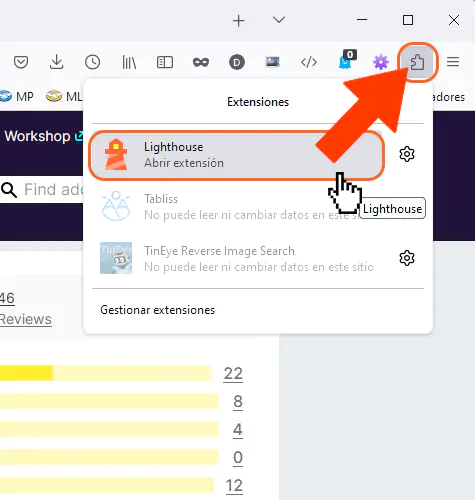
Once installed, the official Google Lighthouse extension can be accessed from Firefox through the extensions icon, as shown in the following screenshot:
Next, we’ll generate the report by pressing the blue button.
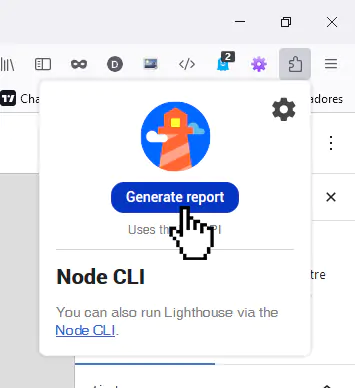
After a loading screen during which data is sent and received, a new tab will open in our browser, and we’ll be able to view the report just as we mentioned earlier.
Generate Lighthouse Reports via PageSpeed Insights
To audit our website externally with Lighthouse, we can go to PageSpeed Insights and enter the corresponding URL there:
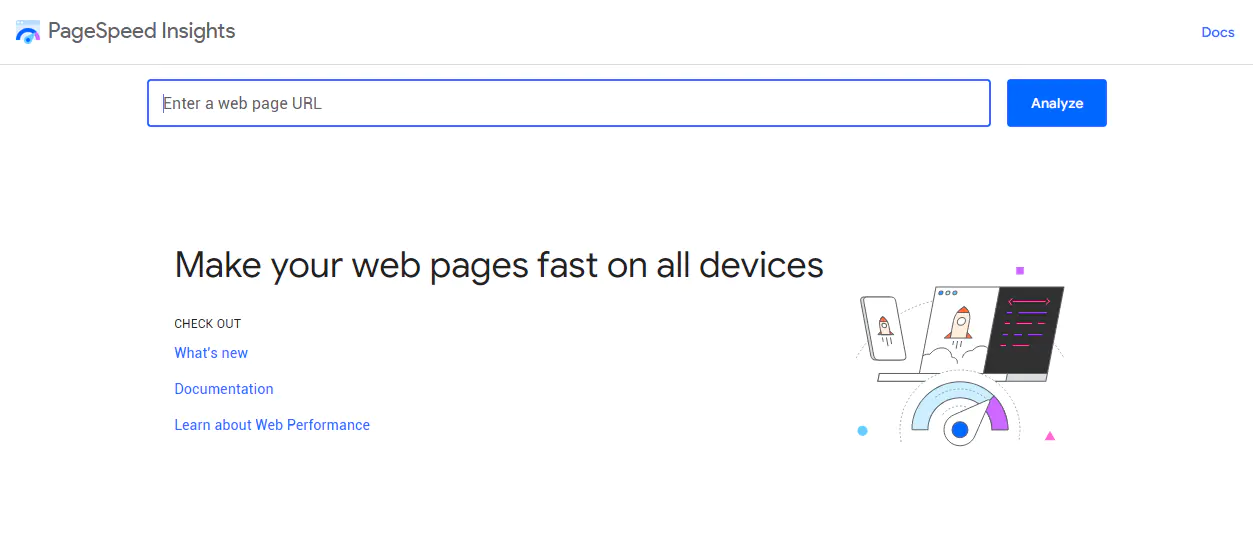
After a few seconds of auditing, we’ll see the screen with the scores mentioned above.
Conclusion
Running the local performance tests provided by Google Lighthouse is a great help when identifying opportunities to improve our site’s loading times, interactivity, accessibility, and SEO.
It allows us to see how Google sees us in turn. And we know that this search engine has a strong “fetish” for web speed. To top it all off, Lighthouse is free, and if our page is not loading within a reasonable time or we notice latency, it is the tool to turn to. At the very least, it is the tip of the iceberg of all the improvements its report will offer us (which we’ll need to work on with time and patience).
Thank you for reading, and we wish you success in your endeavors. Until next time.